In June of 2019, Cruise announced their data visualization web application, Webviz, in a blog post entitled, “Webviz: An Open Source Platform for Robotics Data Visualization.” This follows previous announcements to open source Worldview, a library to translate the data-rich worlds our cars navigate into clear and intuitive 3D scenes, and rosbag.js, a JavaScript library for reading ROS bag files.
The goal of the Webviz project was to streamline the data visualization workflow by presenting data in a more cohesive way, making layout customization much easier and maintaining backwards compatibility. What started as a Cruise hackathon project is now one of the most widely used data analysis tools at Cruise.
The web application contains configurable panels that can be used to visualize data including logs, camera feeds, 2D plots, and 3D scenes. This functionality is similar to native ROS tools such as RViz, rqt_runtime_monitor, rqt_plot, rqt_image_view, rostopic echo, and rqt_console but it doesn’t require the user to install ROS on the host machine. The configuration can be exported as JSON and shared with other users.
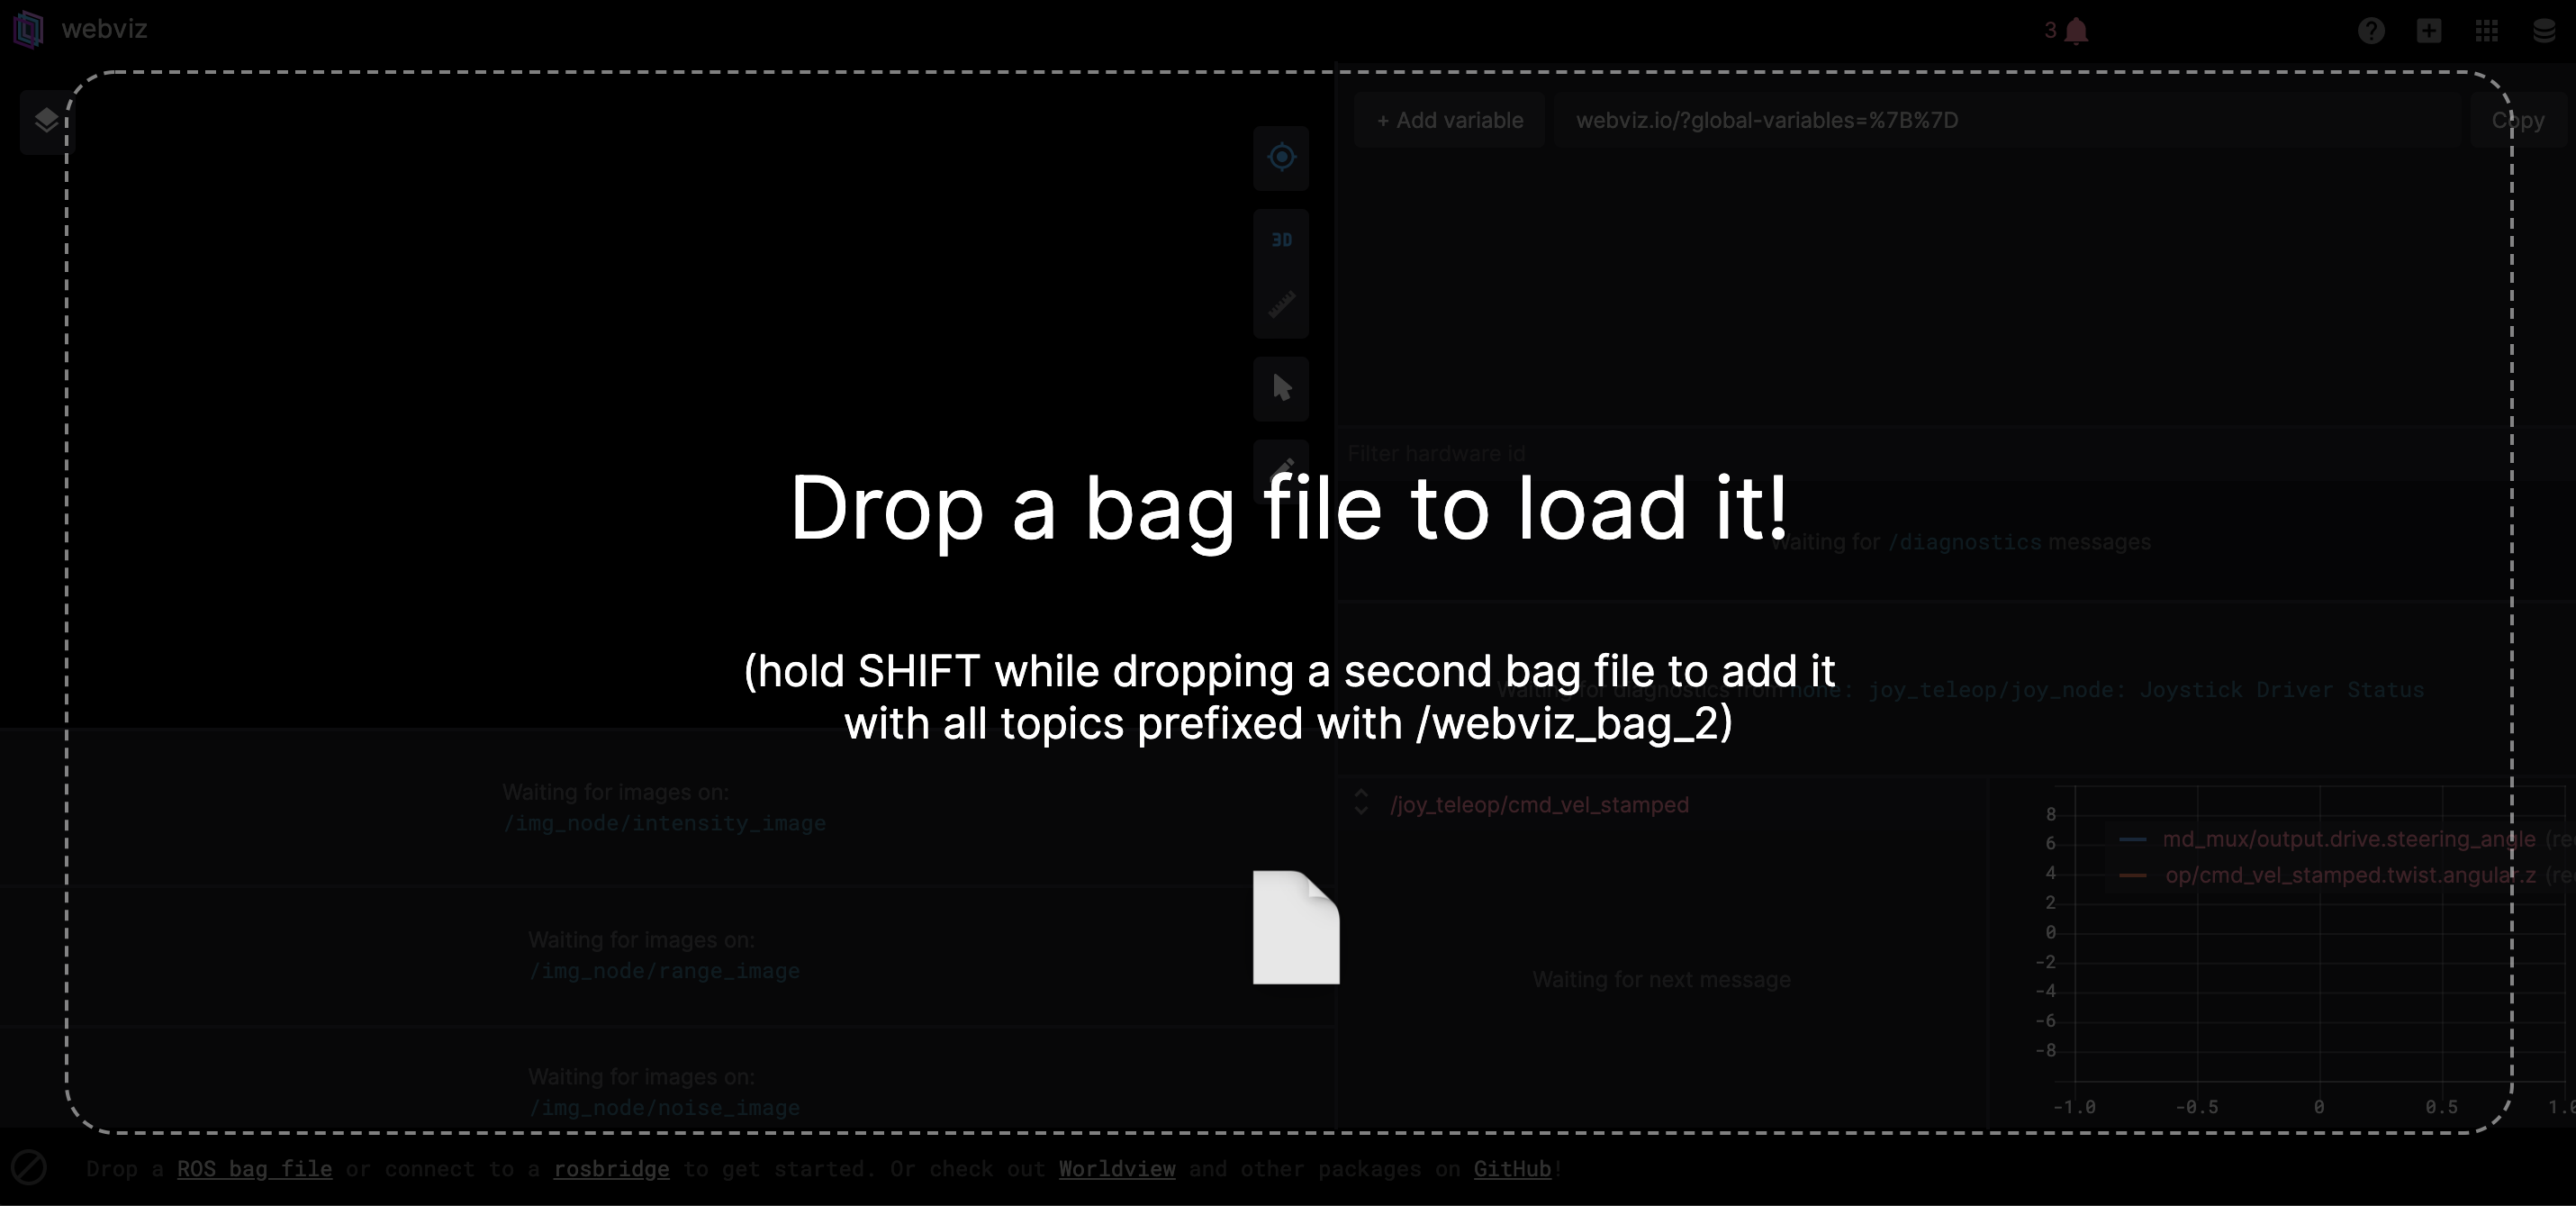
To visualize data, users have two options. By default, the Webviz tool tries to connect to a rosbridge_server using a WebSocket on ws://localhost:9090. For historical data, users can drag ROS .bag files directly into Webviz via the browser. All the data is processed and visualized locally, not sent to any server.

Webviz Provided Demo
Cruise provides a live demo of Webviz along with some sample data. The demo is preconfigured with panels depicting lidar data, a camera feed, plots of radar data, and a hardware diagnostic panel. An example of the demo is shown below.
RC Car Data Collection Platform
The Cruise Webviz is helpful to explore robotic systems running ROS. For this post, the tool will be used in support of the development of an autonomous RC car. This platform is used to explore various aspects of robotics including simulation, state estimation, localization, mapping, path planning, and various Machine Learning applications.
For this project, the base RC platform is the Exceed Blaze (Hyper Blue) vehicle. To mount the hardware, the platform was modified with the Standard Donkey Car Kit.

For sensing, an Ouster OS1-64 lidar sensor is mounted along with a Genius WideCam F100 webcam and an OpenMV Cam M7.
All processing is done on a Compulab fitlet2 with an Arduino Uno providing commands to the motors for steering and throttle via a PCA 9685 Servo Driver. The vehicle can be operated remotely with an Xbox controller.
The Compulab fitlet2 runs Ubuntu 18.04 as the base operating system. ROS is used as the middleware, providing inter-process communication between the software components as well as robot-specific libraries and visualizers. For the ML model development, Tensorflow and Keras are used with Google Colab providing the training environment.
Replaying Simulated Path Planning Data
Cruise also provides an empty Webviz for users to explore their own data. First, it’s helpful to replay some simulated data to verify the proper functionality of the RC car system and to get familiar with the Webviz tool.
The first simulation will consist of a path planning application. Given a known map and a goal position on the map, the RC car will navigate autonomously in the environment to the goal location.
ROS Gazebo is used to simulate the RC car, sensors, and the environment. To generate sensor measurements, the simulation contains a simulated OS-1-64 lidar sensor to get IMU and distance measurements and a simulated camera to produce a video feed. A detailed description of the development of the simulated sensor is available here. The OS1-64 is mounted on a simulated RC car provided by the MIT RACECAR project. Lastly, the WillowGarage world is used as the simulated environment to operate the system. A sample image of the OS1-64 mounted on the racecar platform in the WillowGarage Gazebo environment is below:

The ROS .bag data from the simulation along with the Webviz configuration are both available for download. The ROS .bag file can be dragged directly into the Webviz.
Once the data is loaded, the configuration parameters can be loaded as shown below.
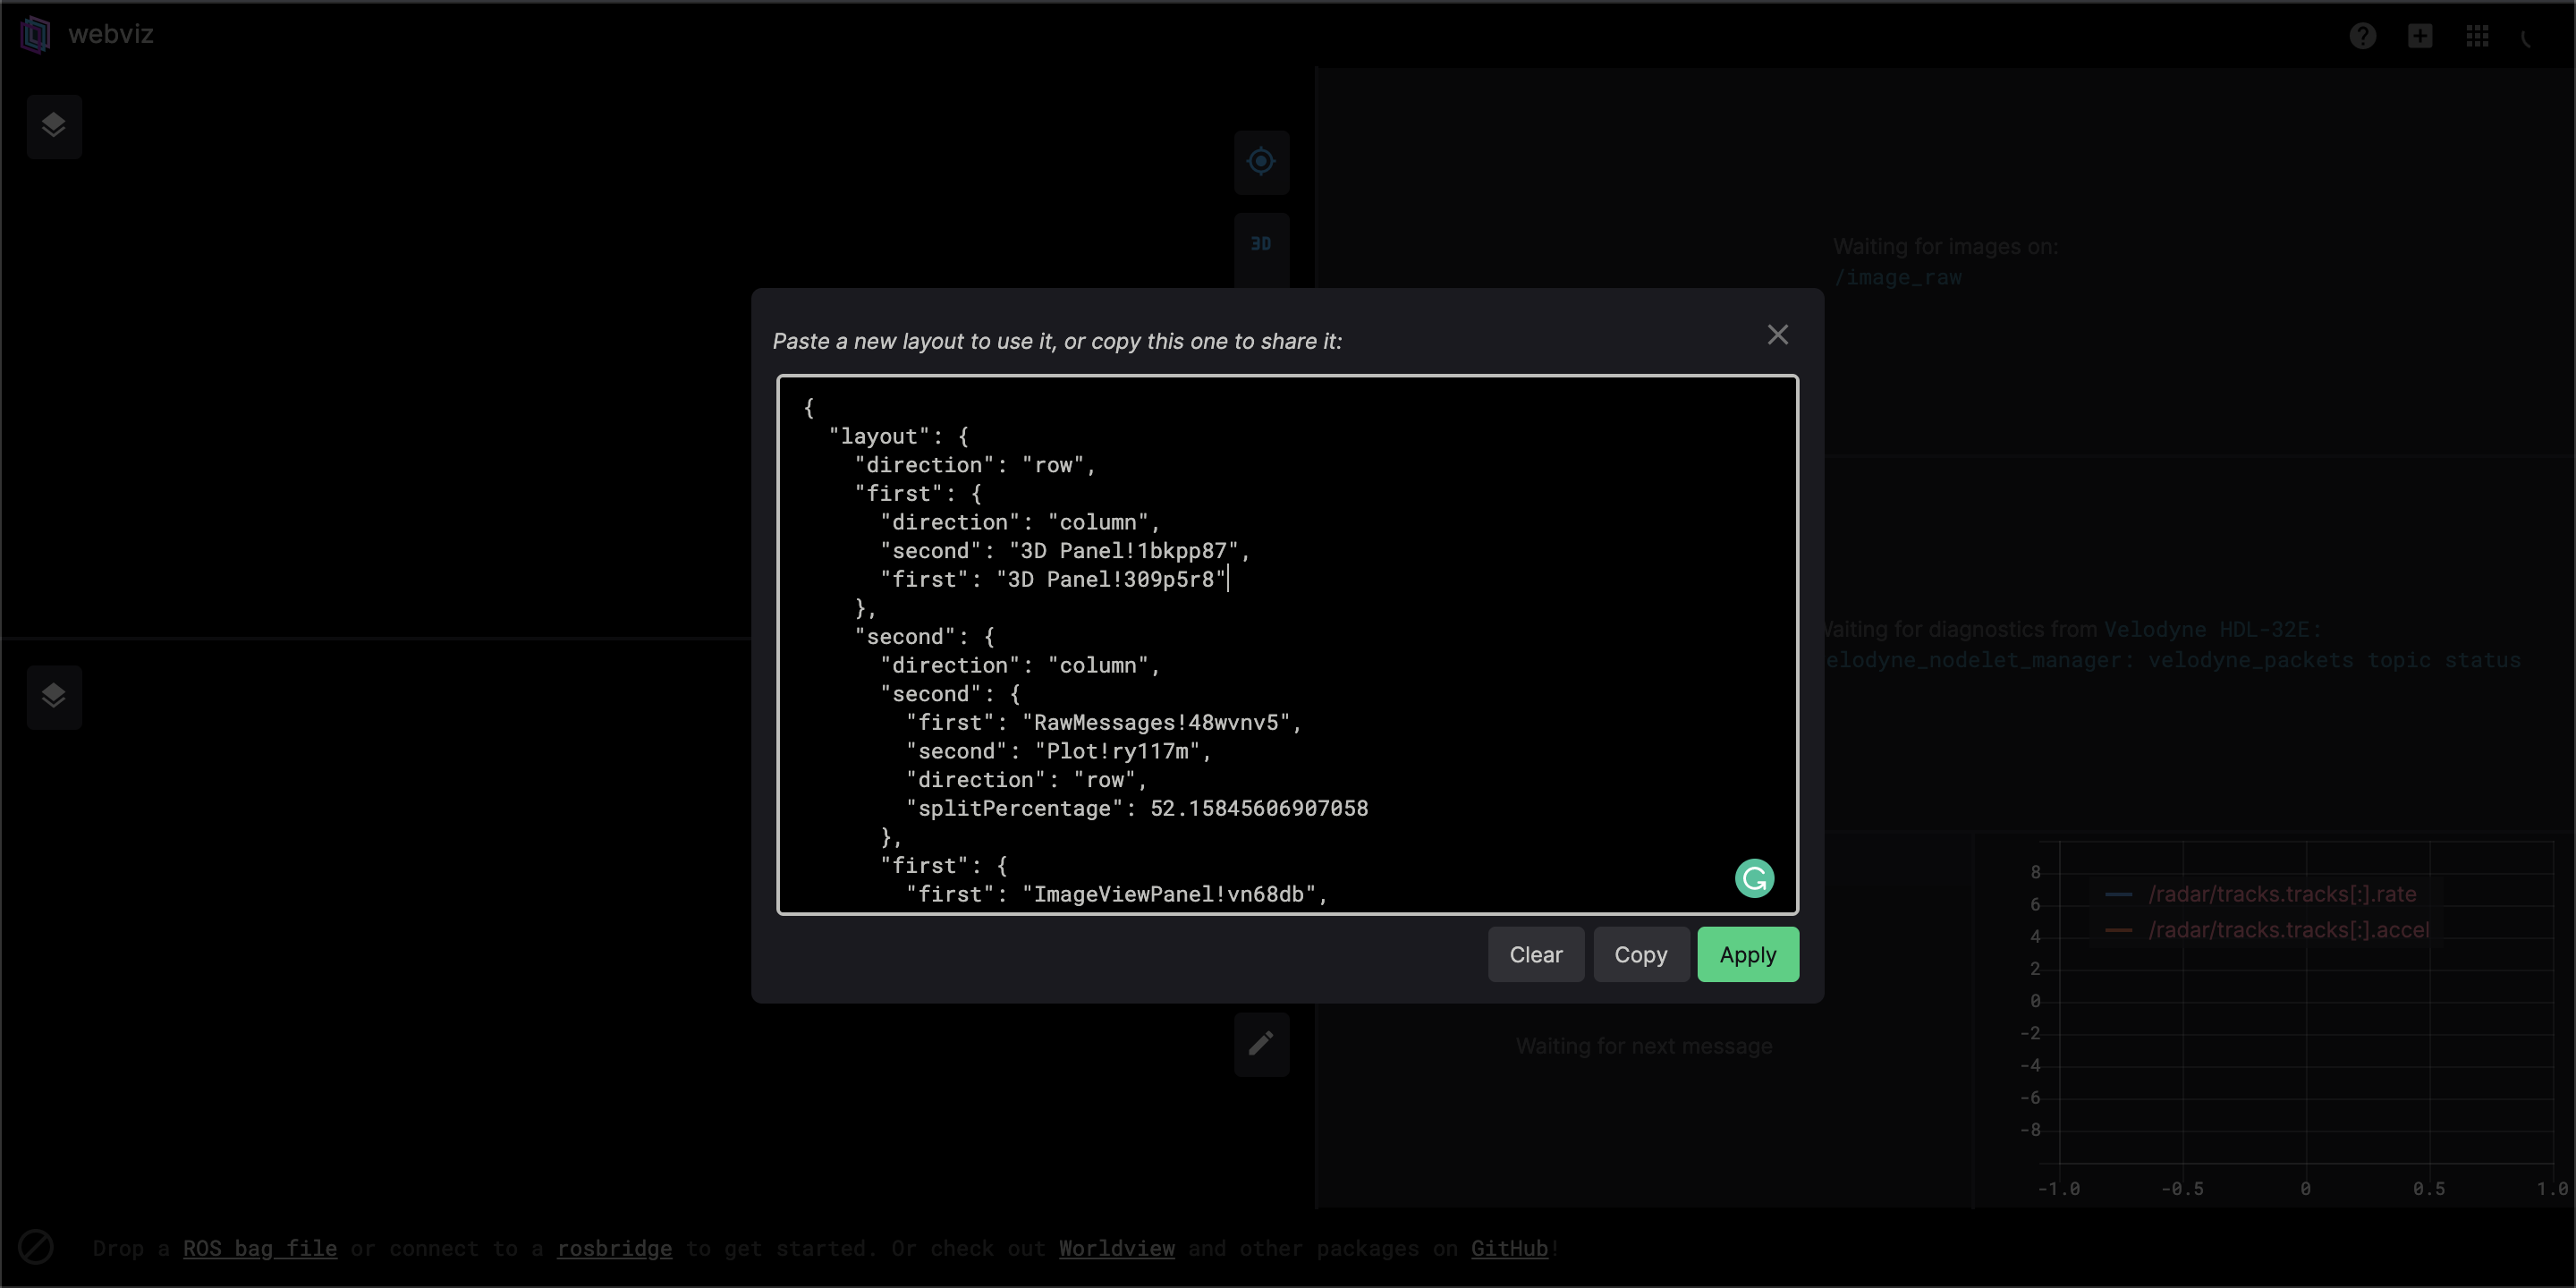
After the data and configurations are loaded, the data can be replayed.
In this configuration, the hardware monitor displays the status of the joystick node in the upper left. The speed and steering angle produced by the path planning algorithm are both plotted on the lower left. The simulated camera images and Ouster OS1-64 lidar pointcloud output are shown in the lower right. The upper left depicts the 2D occupancy grid map overlaid with the global cost map. The local costmap is shown in the multi-color grid around the vehicle and the goal is depicted by the large blue icon.
Replaying Real-World Operational Data
After getting some basic familiarization with Webviz and simulated data, it’s possible to progress to visualizing data collected from the real RC car platform.
The first dataset visualized consists of data collected manually operating the RC car around an outdoor environment. Both the lidar and camera images were recorded. The ROS .bag data from the drive along with the Webviz configuration are both available for download.
The map of the environment was previously generated using the Ouster OS1 lidar data and Google Cartographer (more details here). Odometry was estimated using the lidar and IMU data from the Ouster OS1 lidar sensor (more details here). The location of the RC car on the map was estimated using the Adaptive Monte Carlo Localization ROS package.

The Ouster OS1 lidar is able to output fixed resolution depth images, signal images, and ambient images in real-time, all without a camera. The open source driver outputs these data layers as fixed resolution 360° panoramic frames. This results in camera-like images that can be used with the same ML models developed using a color camera. These camera-like images are displayed in the Webviz in the upper left.
Below the 2D lidar images are two panels depicting the pointcloud from the OS1-64 lidar sensor and a simulated 2D laserscan computer from the pointcloud. The lidar pointcloud needs to be downsampled to a sensor_msgs/LaserScan message using the pointcloud_to_laserscan package to be compatible with the AMCL package.
The lower right panel depicts the video streaming from the onboard camera. The top left panel plots the steering command and throttle from the joystick input used to teleoperate the vehicle.
The middle panel displays the 2D occupancy grid previously recorded. It also overlays the TF frames on the map which depicts the estimated position of the robot on the map.
Replaying ML Inference Data
Another goal of the RC platform was to develop an end-to-end Machine Learning model to steer the RC Car around using the Ouster OS1 lidar as an input. This is inspired by the Udacity Self Driving Car “behavior cloning” module as well as the DIY Robocars races.
For this project, the objective was to develop a ML model that reliably navigates the RC car around a racetrack. The ML model will perform a regression to estimate a steering angle for each intensity image from the lidar.
Previously, the process for training and deploying an ML model to autonomously operate an RC car was described in the post, “RC Car ML Model Development with an Ouster OS1 Lidar.” An example of the RC car navigating the track using the Ouster OS1 lidar data as an input is shown below.

The ROS .bag data from the drive along with the Webviz configuration are both available for download. The dataset was recorded while the RC car was navigating using the ML model to infer settering angle commands. Visualizing the data from the inference is helpful to investigate the performance of the ML model in more detail. The data is visualized in the Webviz below.
The upper left panels depict the camera-like images produced by the OS1 lidar for the range, intensity, and ambient data channels.
The 2D plots depict the steering angle commands produced by the ML model and the throttle value. The throttle command is hardcoded at a constant positive value which is also evident in the second plot.
The upper left panel depicts the pointcloud from the OS1 lidar and the lower right panel depicts the webcam output.
Debugging ML models is sometimes challenging. One technique is to visualize the saliency image. Saliency maps were introduced in the paper Deep Inside Convolutional Networks: Visualising Image Classification Models and Saliency Maps. Saliency maps are based on gradients and they calculate the gradient of the output with respect to each pixel in the input image. This visualizes how the output changes with respect to small changes in the input image pixels.

While the saliency image can help users identify which regions of the image are most impactful to the ML model inference, it doesn’t provide insight into the specific output values that are produced.
The Webviz tool is helpful to visualize the steering command output along with the camera video footage. It’s evident that the steering commands are primarily the minimum and maximum values (+/- 1.57) and few of the values are near 0, even on straightaways. This means the model may be overfitting on sharp turning data and it may be helpful to collect more training data on straightaways to have smoother control over the vehicle.