

The planning fallacy, first proposed by Daniel Kahneman and Amos Tversky in 1979, describes a bias that causes people to underestimate how long something will take and overestimate its impact. As a Product Manager, this is disheartening to read, but also not surprising. Features take longer to release than anticipated and they rarely deliver the maximum value to the user on the first release. Uncertainty internal to the organization makes it difficult to accurately estimate development timelines. Uncertainty external to the organization makes it difficult to gauge the impact of features. We need to develop tools that embrace uncertainty so we can mitigate the effects of the planning fallacy and remain flexible to the realities of an uncertain future.
Uncertainty is Reality
While we developed tools to make sure we are solving real user problems (design thinking) and methodologies to deliver them quickly (lean startup, agile software development), the future will always be uncertain because we are dealing with ill-structured problems. These problems have many possible solutions, some better than others. Yet we still communicate our plans with gantt charts and timeline-based roadmaps which portray an orderly and deterministic future where everything ships on time and immediately delivers value for the business.
These planning artifacts don’t clearly represent the assumptions we are making about the future and the uncertainty we face. We assume we know how long each feature on the roadmap will take to develop. We assume our plans won’t change in reaction to the competition or the market. We assume that every feature adds value when in reality, companies like Google only see positive results on 20% of their experiments. The further out we look, the less certain our ideas are.
Gantt charts and time-based roadmaps reflect a mindset that prioritizes output, yet we are judged by the outcomes we deliver. How we handle this uncertainty can become a competitive advantage. We need to be flexible, able to quickly adapt to take advantage of opportunities as they arise. We rely on a strong product vision and clear business objectives to empower product teams, pushing the decision making down to those closest to the problem. As Janna Bastow points out, “a great team knows that it’s not about what they build (because their first assumptions will always be wrong anyway), but about having a good process.”
How can we leverage uncertainty and turn it into a competitive advantage? How can we build a process that focuses on outcomes rather than output? We can start by using opportunity solution trees to organize our product discovery findings. We can then rely on time horizon roadmaps to communicate our product strategy and probabilistic schedules to communicate our delivery timelines.
Building a Tree of Opportunities
The planning fallacy states that we often overestimate the value our features will deliver. There’s two aspects to this from the user centered design perspective. We need to not only design the right thing, we need to also design things right. Product discovery and user research methods can help us identify opportunities while prototypes and user tests can help refine our designs. But we can’t solve every problem. How do we organize all of our insights so we can decide what to build next?
One of the characteristics of the type of ill-structured problems product teams tackle is that they have multiple solutions. There aren’t necessarily right or wrong answers, but some are better than others. Terea Torres developed the idea of Opportunity Solution Trees as a simple visual to help externalize our thoughts.
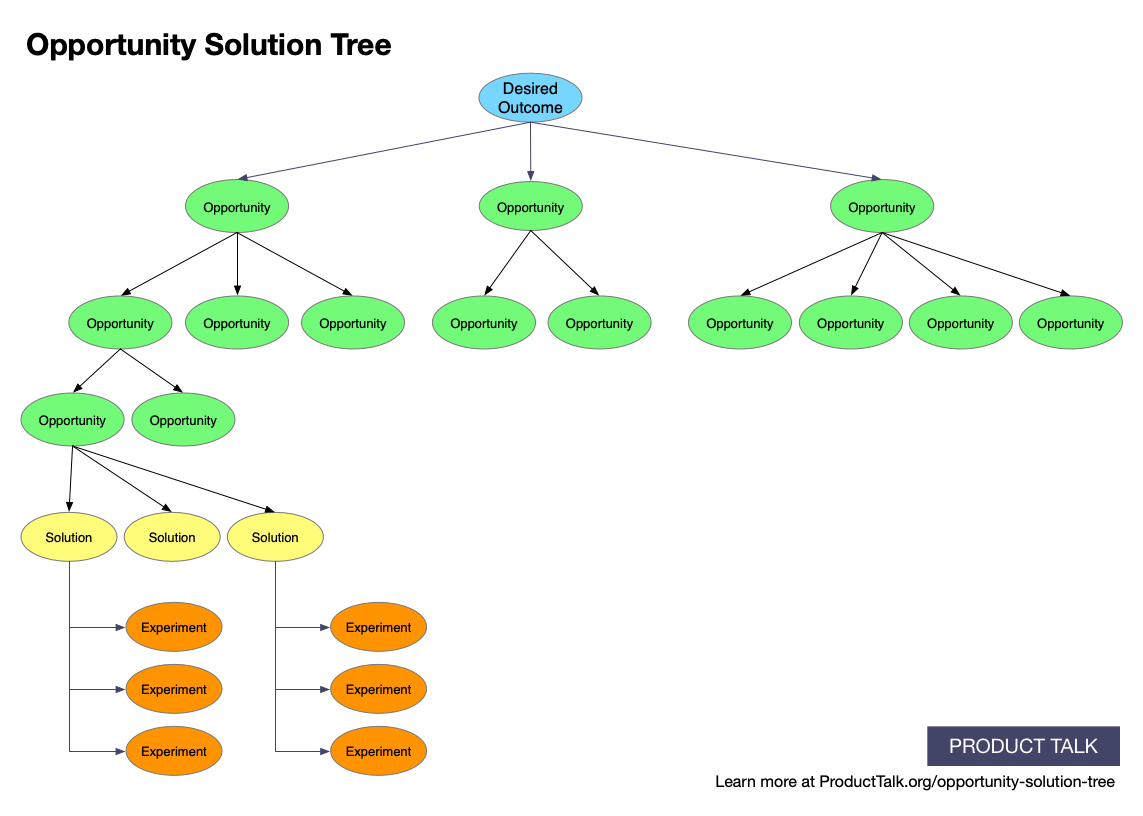
The Opportunity Solution Tree starts at the top with a clear desired outcome. Under the desired outcome, we branch off into different opportunities we’ve identified through generative or market research that we believe will drive that outcome. Opportunities can be thought of as pain points or needs but also as opportunities to delight the user. Opportunities can be described at different levels, creating a hierarchical structure. Under each opportunity, we can link the solutions we think connect to a targeted opportunity. Lastly, under each solution, we can list different experiments that will allow us to test a solution..

An Opportunity Solution Tree can be thought of as a type of affinity diagram. In Making Things Happen, Scott Berkun describes how lists promote linear thinking and become hard to manage at scale. He states that affinity diagrams are more powerful.
They help people see ideas as fluid and tangible things that can be moved around and easily reorganized. This fluidity helps people to question their assumptions, see new perspectives, and follow other people’s thoughts.
This tool allows us to document our product discovery efforts. It ensures that we explore multiple opportunities as well as multiple solutions so we don’t fall in love with the first idea we develop. It keeps us focused, ensuring that every opportunity, solution, and experiment we investigate is linked to an outcome that will drive our business forward.
It also helps guide prioritization discussions and can be used to justify the decisions we make. We can prioritize down the length of the tree, starting with assessing which opportunities are most likely to achieve the target outcome. Since there is no one right idea, we can use this visual tool to make sure we are making fair comparisons between solutions by discussing ideas that deliver on the same opportunity.
The Opportunity Solution Tree can help us figure out what route to take. The tool can guide our discovery efforts to make sure we’ve fully explored the opportunity space and anchor our brainstorming and experimentation efforts to ensure we’re focused on solutions that will help us reach our desired outcomes. This enables us to quickly identify emerging opportunities to our advantage. But once we’ve identified our target opportunities, we need a way to communicate internally and externally the order we are going to address them.
A Roadmap Built for Flexibility
Marty Cagan identifies two primary purposes for a roadmap. First, by visualizing the upcoming features and initiatives, the roadmap allows executives to see where we are investing resources and verify we are working on the highest business value items. Second, roadmaps allow us to track time based commitments which enable other departments to align their schedules appropriately. Any structural changes to the roadmap will still need to meet those requirements to be an effective replacement.
The key insight is that the roadmap isn’t meant to be a perfect plan of all the features the team is working on at the day, week, or month level. The roadmap is a strategic communication tool that shows the upcoming initiatives your team is tackling in order to accomplish some higher level objectives guided by the product vision. Janna Bastow says, “your roadmap is a prototype for your product strategy.” She notes that the roadmap is meant to change as you learn more, and thus we need a roadmap format which provides this flexibility.
Instead of a time-based roadmap, which looks similar to a gantt chart, the idea is to use a time horizon roadmap and list opportunities to address, not specific solutions. The roadmap organizes opportunities into three time horizons. Items that are well defined in scope with feature specifications and designs are in the “now” column. These are items that are ready for development or in development. In the “next” column are items with a wide area of focus, potentially still various stages of user research or product discovery activities. Items in the “next” column are broad in scope and loosely understood.

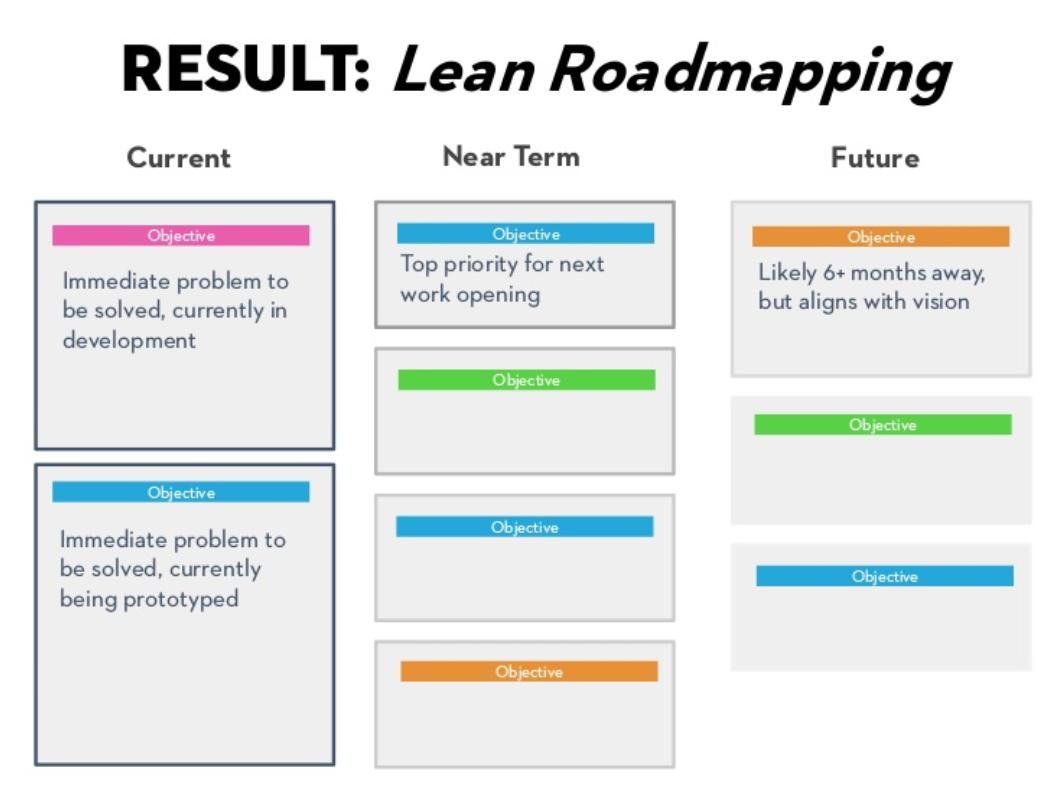
You can adapt the taxonomy to your team’s or organization’s specific circumstances but the idea is that each column represents a change in visibility and flexibility in your roadmap. The further out you look, the problems are less understood and likely to change in priority as we learn more about the competition, market, and our users. Using this format, we are able to clearly show the trajectory of the product and how we think we will achieve the product vision without explicitly committing to specific features by specific timelines. This model also accounts for the fact that a feature may not work as intended or need to be refined over time. The opportunity stays on the roadmap until it’s deprioritized or relevant performance targets are achieved.
How does the time horizon roadmap reassure the leadership that the team is working on the highest business value items? Ideally, the management team provides priorities through OKRs or some other goal setting process. The opportunities on the roadmap can be organized to display which of the goals they support. This frees the product, design, and engineering teams to solve the problems as they see fit, empowering them to achieve the business goals. It also holds them accountable for achieving the goals and not just shipping features.
Additionally, since the roadmap is populated at the opportunity level and not the more populated solution level, the roadmap is no longer cluttered with features and it enables the team to focus on a subset of customer opportunities. This also requires the team to be continually gathering insights from users and other sources to refine and reprioritize the opportunities. Similar to the Opportunity Solution Tree, this structure allows the team to analyze their thinking and view the roadmap as fluid and easily reorganized.
But how do we handle time commitments if we only display loose time horizons? How will we coordinate with other teams? Marty Cagan describes the concept of high integrity commitments. Ideally, we want to minimize these commitments so we can maintain the flexibility of the time horizon roadmap. When they are required, we want to run through the product discovery process and validate the solution with users until we have confidence that our solution will deliver the business value we expect.
Once we have a solution that is viable from a business, technology, and user perspective, we can begin to estimate when we could deliver this feature. The roadmap isn’t a release schedule, so we need a different toolset to communicate delivery times.
Schedules That Visualize Uncertainty
Where the roadmap describes the product strategy, a release schedule is focused on execution and is used to help the team coordinate delivery. The release schedule is typically short term and only contains the work that has been scoped and committed to. It can contain time estimates, milestones, and dependencies for tasks and features. It enables different teams to coordinate resources and can be used for capacity planning and cost estimation to create a budget.
In reality, we never follow the schedule exactly. That’s because the schedule isn’t deterministic, it only displays a single outcome out of a set of potential outcomes. The traditional schedule format doesn’t easily account for the uncertainties inherent in the product delivery process.
If we are continually impacted by the planning fallacy and underestimate the time tasks will take, why should we go through the challenge of trying to create an accurate schedule in the first place when nobody believes it to be realistic? First, as discussed before, businesses are driven by dates. They are used to coordinate the work of different teams and create time pressure that drives tradeoff and prioritization conversations. This means that if the development team won’t provide an estimate, someone else will do it for them. That could impact whether or not the project is approved or even appropriately staffed.
Since we can’t really avoid schedules, the goal of estimation should be to get the estimate as quickly as possible and with minimal disruption for the team. To make the estimation process easier, we break the work down into small, simple tasks. But how do we account for the uncertainty associated with the task? The answer is to express the uncertain estimate as a distribution, not a single number. As Sam Savage explains in his book, The Flaw of Averages, “uncertain quantities cannot be represented by single numbers, rather they are a range of numbers each with a different probability of occurrence.”
It turns out that the log normal distribution is a good approximation for modeling development tasks and even entire projects. The log normal distribution is characterized by a short cut off, a peak, and a long, decaying tail. The actual completion time of a task is generally near the estimate, but there is a long tail of instances where the task takes much longer than the original estimate. This distribution also has the property that the mean is much longer than the median. This is interesting, since it appears that people estimate the median duration of a task accurately but not the mean. The problem is, medians don’t add but means do. So when we combine estimates for multiple tasks, we are further compounding the errors. One task with high uncertainty can dominate the completion time for the entire project (which is why we should run pre-mortems to identify the risks and tackle the risks early in a project).


So we can ask the team for estimates, maybe even ask them for a 90% confidence interval to get a better understanding of the distribution of the task. But maybe we don’t need to ask for estimates at all. In his book Thinking Fast and Slow, Daniel Kahneman says one technique to mitigate the planning fallacy is to use bayesian thinking which relies on reviewing historical data from previous projects as a base for estimating the duration of a new project. A good place to start is to measure the cycle time of previous tasks, tracking the time work starts and completes on each task. This historical data can be used to generate the distribution for a generic task and forecast the likelihood of a task completing in a certain period of time.
Given a distribution created from estimates or historical data, we can leverage probabilistic modeling techniques that were specifically designed to handle these uncertainties. One of the more common methods is the Monte Carlo simulation. This tool randomly samples the distribution to simulate multiple future scenarios of the project, resulting in a probability distribution that can be used to determine the probability of the project finishing by a certain date. These simulations make the uncertainty in the estimates explicit by showing not just one competition date, but the probability that we will ship on any given date. Using this tool, we can add or remove features and see how the schedule improves. Joel Spolsky has a great overview of how his team used these schedules for those interested in more details.


Turning Uncertainty into a Competitive Advantage
Daniel Kahneman and Amos Tversky proposed the planning fallacy in 1979 yet we are still relying on tools that fail to acknowledge that the future holds more than one possible outcome and we can’t know what the one outcome will be. We’re uncertain what our competitors will do. We’re uncertain how well our new feature will be received by our users. We’re uncertain how long the development team will take to work through the features in the backlog.
We need to embrace tools that allow us to remain flexible in the face of this uncertainty while acknowledging that other stakeholders in our organization will need some structure in order to coordinate their team’s activities effectively.
Guided by our product vision and business objectives, we can use an Opportunity Solution Tree to organize the results of our product discovery efforts. With our opportunities and solutions clearly depicted, we can visualize our thinking and walk others through our decision making process.
We can select the opportunities we believe will best drive our business forward and overlay them on a time horizon roadmap. This fluid format is adaptable to change as we learn more about our users and the market. We can clearly communicate the path to achieve our product vision and business objectives without being overly committed to deliver features by specific dates.
When we must make commitments to deliver features by a specific date, we can leverage probabilistic modeling techniques to determine the probability of delivering the feature on any given date. These schedules recognize that uncertain quantities must be represented by distributions, not by a single number. Recognizing that making individual estimates is error prone, we can model historical task completion data to create an accurate distribution without bothering the team for estimates for every task.
Leveraging these tools, we can adapt to the changing nature of business and rapidly exploit opportunities, turning uncertainty into a competitive advantage.